Money loses value
Rising prices mean: you can buy less for the same money. Gold cannot be multiplied and preserves purchasing power in the long term.
Gold · Live
–/ ounce
today
No central bank can print it. The gold price in real time – with history, high and low.
Bars at a glance
11.11.2026, 14:24
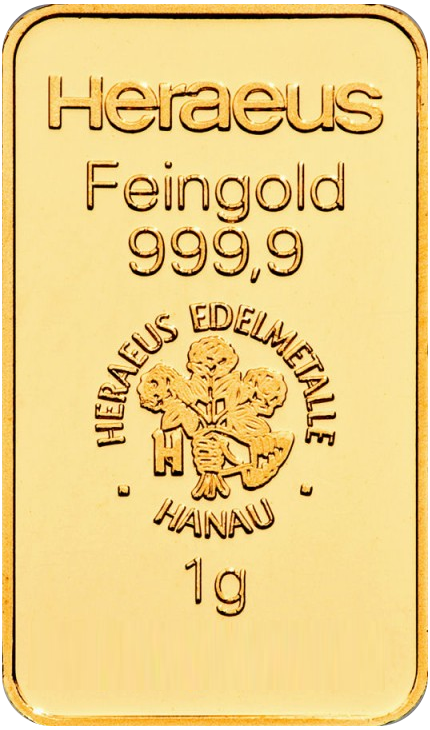 1g Goldbarren | 136.30 € | 113.76 € |
|---|---|---|
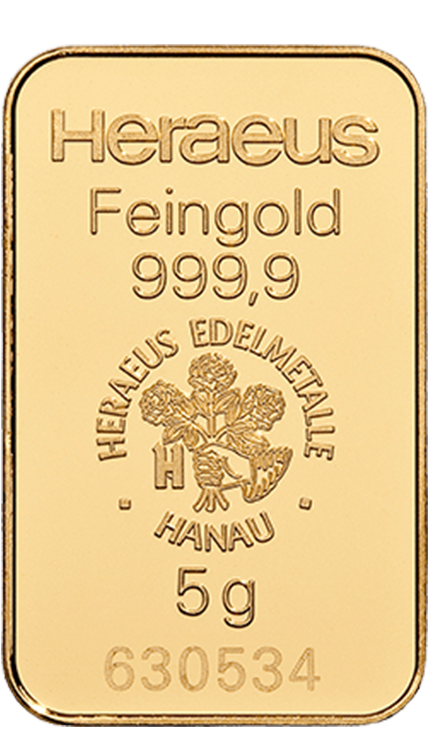 5g Goldbarren | 608.62 € | 576.19 € |
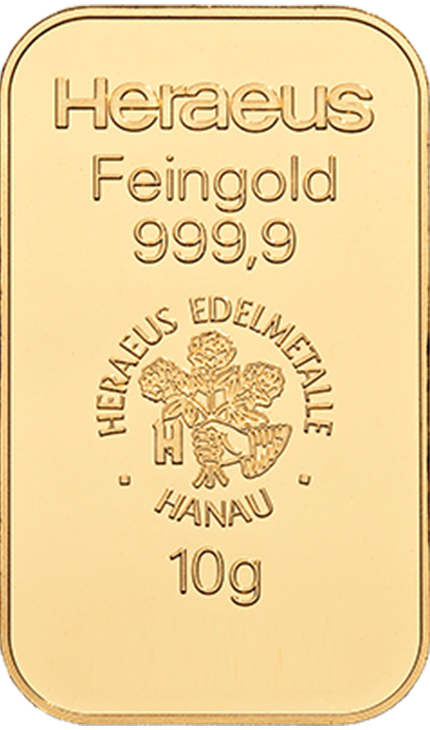 10 g Goldbarren | 1,211.34 € | 1,152.39 € |
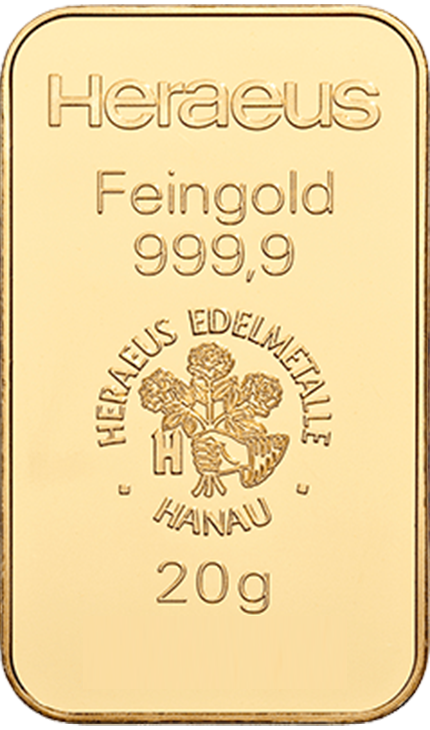 20g Goldbarren | 2,397.82 € | 2,295.37 € |
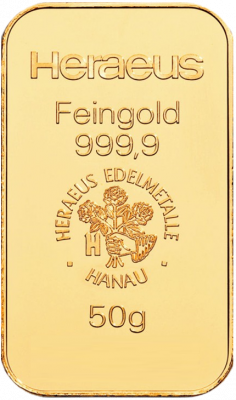 50g Goldbarren | 5,935.10 € | 5,714.94 € |
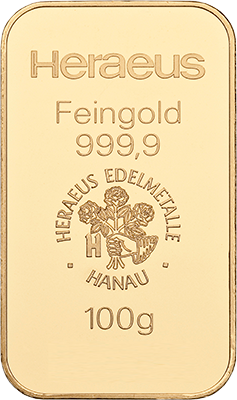 100g Goldbarren | 11,952.45 € | 11,434.57 € |
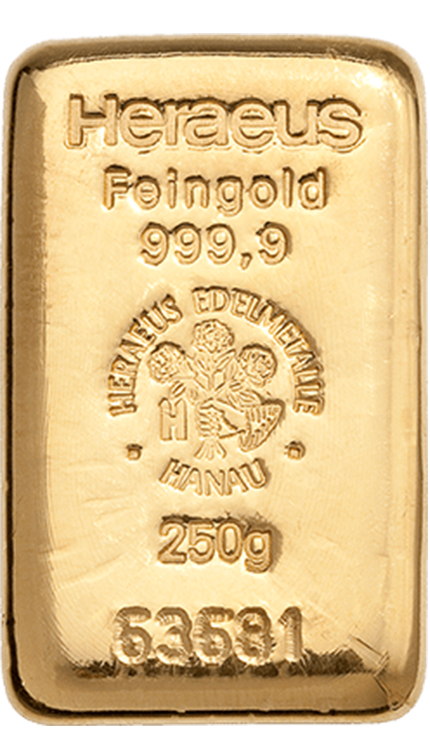 250g Goldbarren | 29,766.97 € | 28,513.00 € |
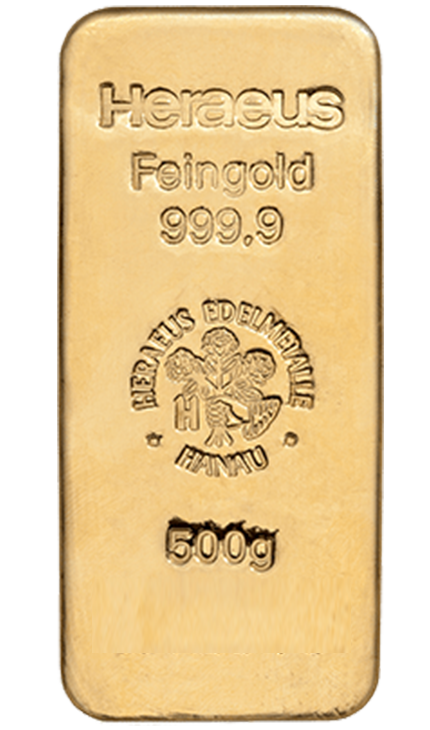 500g Goldbarren | 59,392.02 € | 57,190.50 € |
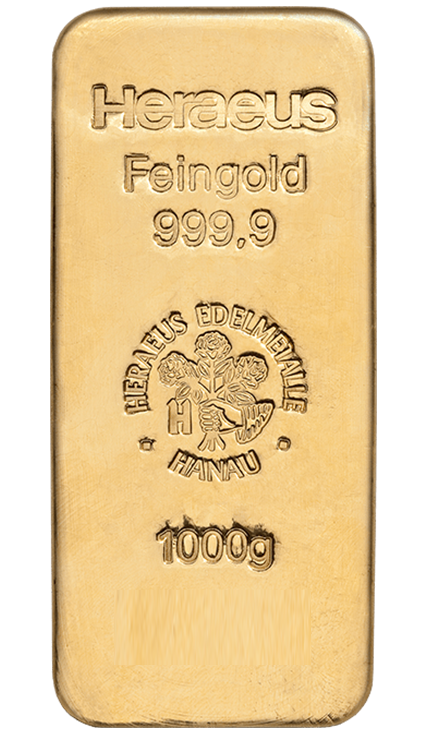 1000g Goldbarren | 119,502.46 € | 114,287.00 € |
Prices incl. taxes as per shop. No guarantee.
Bars at a glance
11.11.2026, 14:24
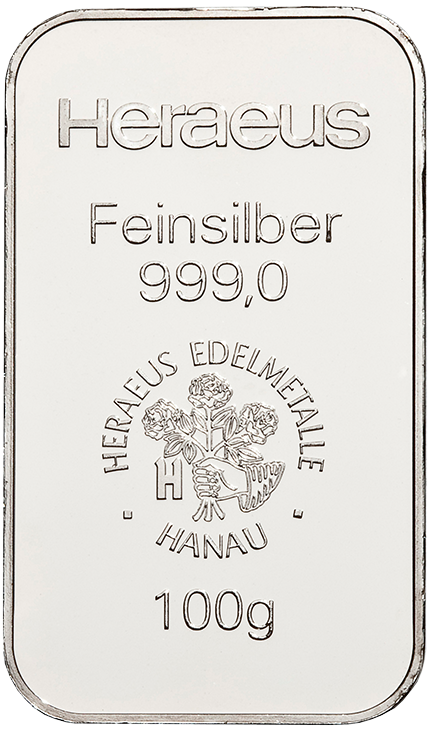 100g Silberbarren | 249.34 € | 147.35 € |
|---|---|---|
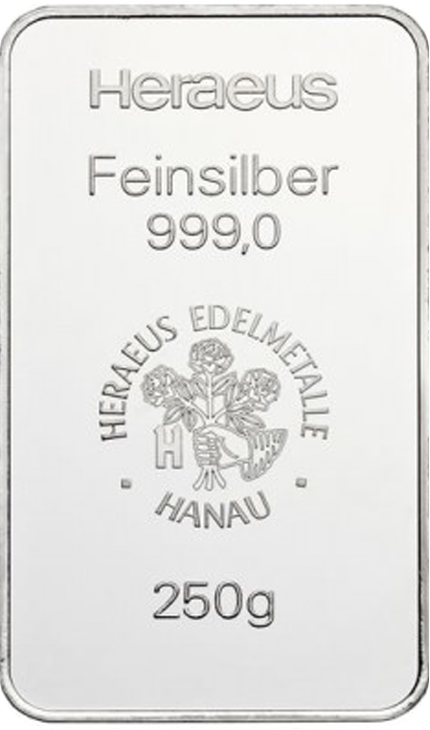 250g Silberbarren | 588.98 € | 349.14 € |
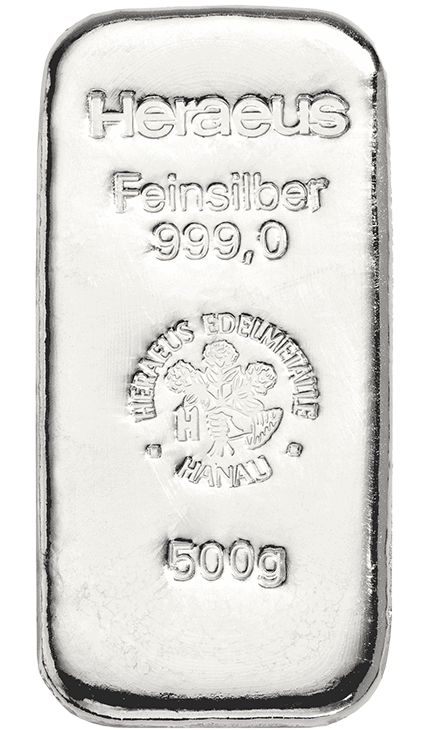 500g Silberbarren | 1,146.39 € | 698.28 € |
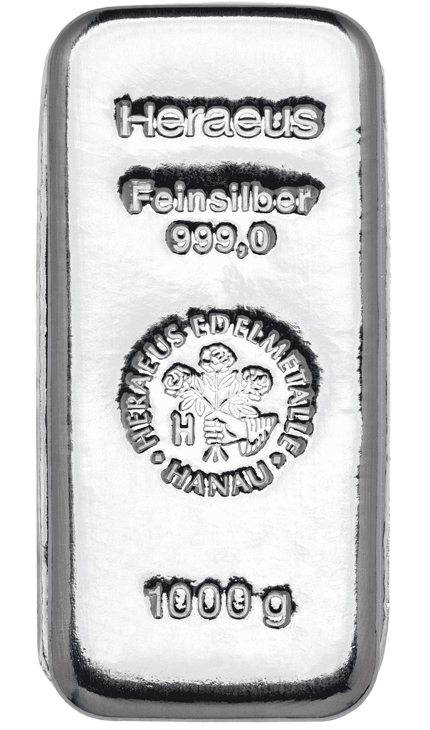 1000g Silberbarren | 1,931.85 € | 1,396.56 € |
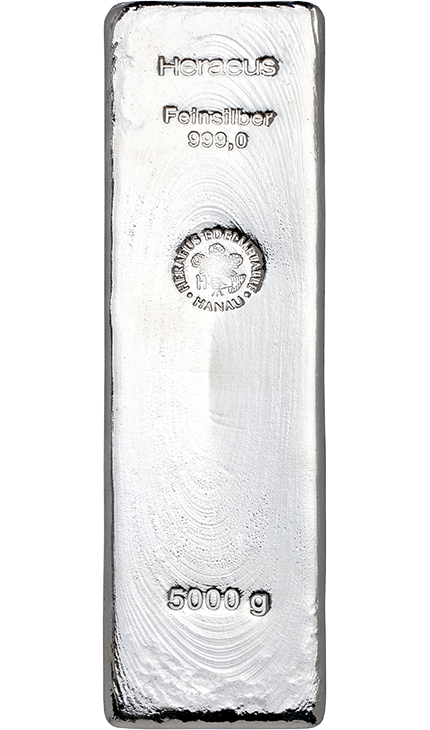 5000g Silberbarren | 9,655.11 € | 6,986.64 € |
Prices incl. taxes as per shop. No guarantee.
Bars at a glance
11.11.2026, 14:24
 1g Platinbarren | 86.66 € | 44.74 € |
|---|---|---|
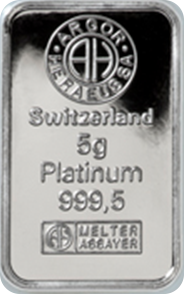 5g Platinbarren | 355.06 € | 222.53 € |
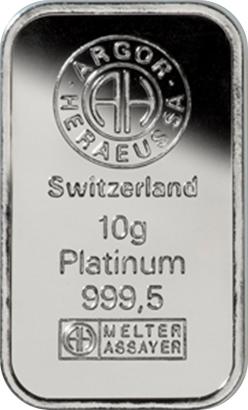 10g Platinbarren | 665.41 € | 442.70 € |
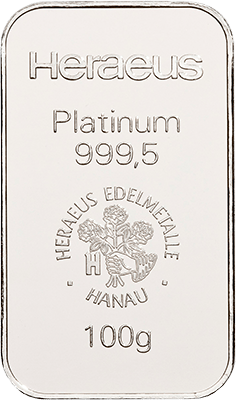 100g Platinbarren Diverse Hersteller | 6,053.39 € | 4,403.57 € |
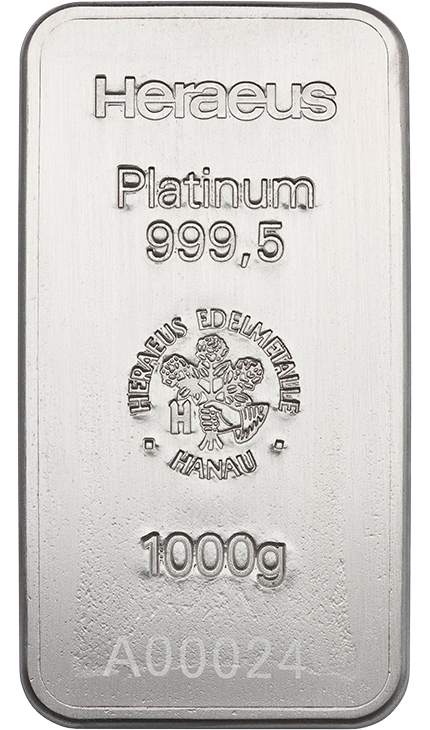 1000g Platinbarren diverse Hersteller | 60,254.49 € | 43,096.58 € |
Prices incl. taxes as per shop. No guarantee.
Bars at a glance
11.11.2026, 14:24
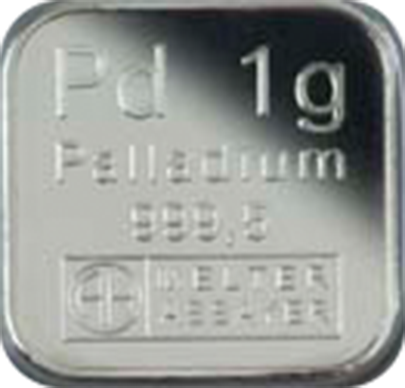 1g Palladiumbarrem | 1 g | 64.38 € | 31.39 € |
|---|---|---|---|
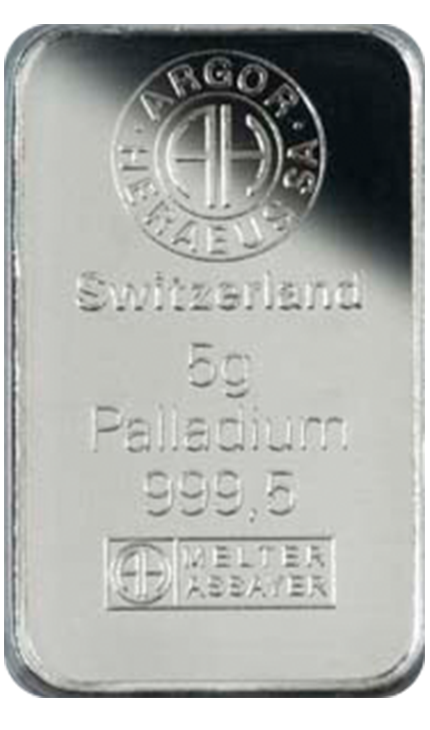 5g Palladiumbarren | 5 g | 250.70 € | 156.16 € |
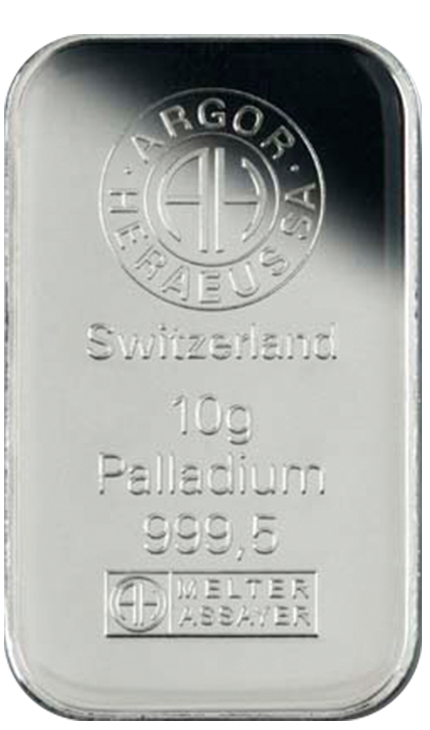 10g Palladiumbarrem | 10 g | 455.21 € | 310.71 € |
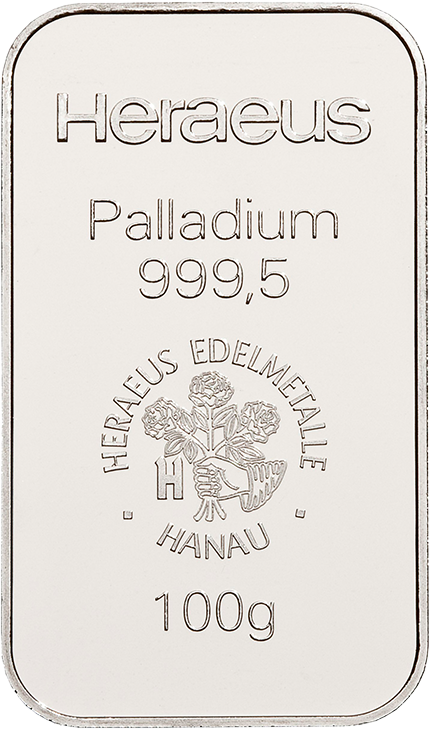 100g Palladiumbarrem Kopie | 100 g | 4,272.99 € | 3,090.90 € |
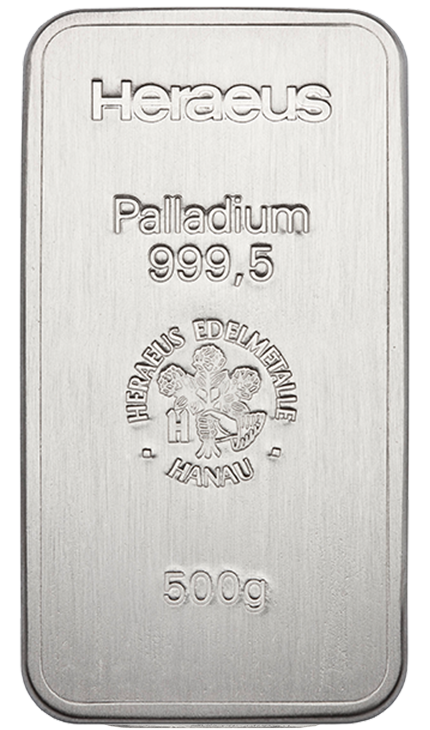 500g Palladiumbarrem | 500 g | 20,787.53 € | 15,373.62 € |
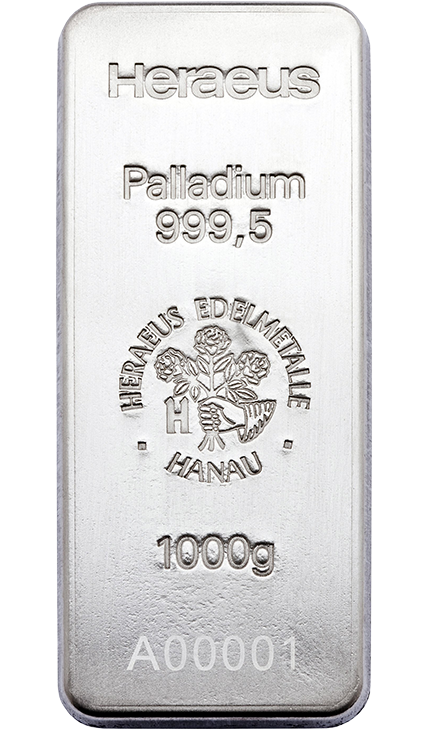 1000g Palladiumbarrem | 1,000 g | 40,997.64 € | 30,174.68 € |
Prices incl. taxes as per shop. No guarantee.
These large standard bars are used in international gold trading – including between banks and central banks.
At Auvesta you can buy shares of these large bars with even small amounts.
More about the LBMA: www.lbma.org.uk

From just 1 euro you buy parts of large bars at a favourable price per gram
As of: 11.11.2026, 14:21● live
Prices incl. taxes. No guarantee.
From just 1 euro you buy parts of large bars at a favourable price per gram
As of: 11.11.2026, 14:21● live
Prices incl. taxes. No guarantee.
From just 1 euro you buy parts of large bars at a favourable price per gram
As of: 11.11.2026, 14:21● live
Prices incl. taxes. No guarantee.
From just 1 euro you buy parts of large bars at a favourable price per gram
As of: 11.11.2026, 14:21● live
Prices incl. taxes. No guarantee.
This is how a purchase of €1,000 would have developed since the year 2000.
€1,000 in Gold · start 2000
2025 11,364 €€1,000 in Silver · start 2000
2025 10,431 €€1,000 in Platinum · start 2000
2025 3,598 €€1,000 in Palladium · start 2000
2025 2,810 €| Year | Gold | Silver | Platinum | Palladium |
|---|---|---|---|---|
| 2000 | +0.89 % | −2.82 % | +52.15 % | +148.80 % |
| 2001 | +12.67 % | +2.84 % | −19.32 % | −58.32 % |
| 2002 | +5.35 % | −11.32 % | +10.93 % | −48.11 % |
| 2003 | −2.44 % | +10.50 % | +13.82 % | −28.47 % |
| 2004 | −1.31 % | +0.71 % | −2.91 % | −17.48 % |
| 2005 | +40.21 % | +49.79 % | +29.58 % | +59.14 % |
| 2006 | +7.14 % | +30.75 % | +4.17 % | +14.93 % |
| 2007 | +24.32 % | +9.82 % | +21.83 % | −2.03 % |
| 2008 | +7.34 % | −21.44 % | −33.52 % | −44.12 % |
| 2009 | +20.80 % | +46.19 % | +52.86 % | +114.10 % |
| 2010 | +29.57 % | +70.80 % | +22.11 % | +95.06 % |
| 2011 | +26.55 % | +12.01 % | −12.63 % | −13.84 % |
| 2012 | −2.17 % | −1.77 % | +5.86 % | +4.85 % |
| 2013 | −27.24 % | −37.56 % | −15.45 % | +0.63 % |
| 2014 | +17.92 % | +0.81 % | +2.38 % | +25.14 % |
| 2015 | −6.26 % | −12.46 % | −26.47 % | −31.73 % |
| 2016 | +11.06 % | +22.61 % | +16.26 % | +52.97 % |
| 2017 | −4.93 % | −13.67 % | −16.35 % | +22.29 % |
| 2018 | +2.29 % | −8.33 % | −14.38 % | +22.22 % |
| 2019 | +21.05 % | +18.56 % | +23.17 % | +50.01 % |
| 2020 | +22.32 % | +22.53 % | +2.72 % | +31.84 % |
| 2021 | +1.96 % | −7.54 % | −3.88 % | −13.13 % |
| 2022 | +5.57 % | +7.56 % | +13.76 % | −1.48 % |
| 2023 | +5.04 % | +4.81 % | −1.09 % | −38.34 % |
| 2024 | +18.29 % | +20.67 % | −11.35 % | −26.49 % |
| 2025 | +47.50 % | +133.20 % | +97.06 % | +55.28 % |
| Ø | +10.90 % | +13.36 % | +8.13 % | +14.37 % |
Calculated: €1,000 at the start of the year 2000.
Important to know: Past performance is not a reliable indicator of future performance. The value of precious metals can rise and fall. Figures exclude costs, fees and taxes.
Source: www.lbma.org.uk, 01/2026
Current market data
All prices per troy ounce (1 oz = 31.1035 g)
Rising prices mean: you can buy less for the same money. Gold cannot be multiplied and preserves purchasing power in the long term.
In 1999, €100 bought 12.77 grams of gold. Today it is only 0.83 grams. That is 93.5% less gold for the same money.
In times of crisis many people turn to gold. Rising demand can push the gold price up. For centuries gold has been used as a way to protect wealth in uncertain times.
Gold cannot be mined indefinitely. The total quantity still extractable is estimated at around 45,300 tonnes and, at the current rate of mining, will last only about 15 more years.
The world’s major states are currently increasing their gold reserves. Gold mining amounts to approx. 3,000 tonnes a year, while demand for gold is currently approx. 4,100 tonnes a year.
International investment houses recommend securing part of your wealth with physical gold. Asset managers buy a portion in gold for their wealthy clients as a safeguard. The central banks of nations hold gold as currency reserves.
This website only uses technically necessary cookies. No tracking takes place. Privacy policy