Platinum · Live
Platinum – rarer than gold.
–/ ounce
today
In demand for catalytic converters and hydrogen technology. The platinum price in real time, with high and low.
- Per gram
- –
- 7 days
- –
- 1 year
- –
Gold bars
Bars at a glance
11.11.2026, 14:24
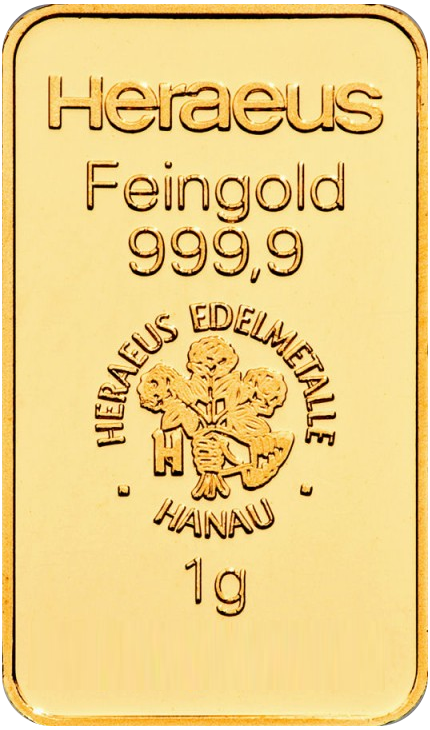 1g Goldbarren | 136.30 € | 113.76 € |
|---|---|---|
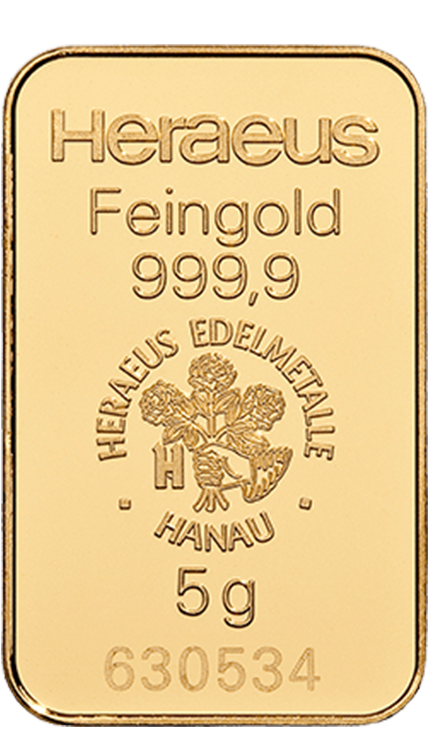 5g Goldbarren | 608.62 € | 576.19 € |
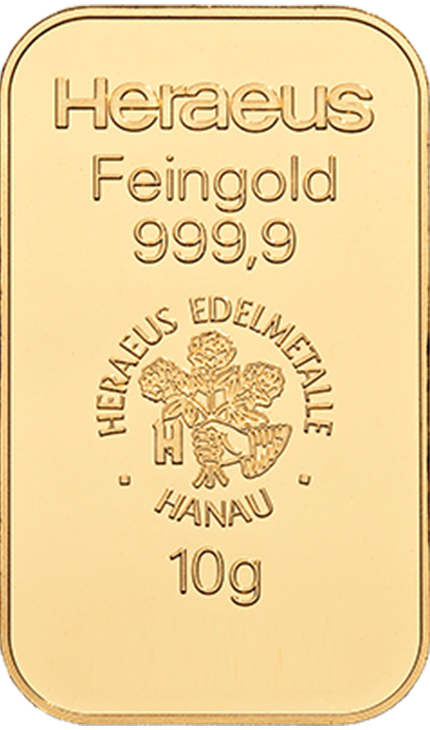 10 g Goldbarren | 1,211.34 € | 1,152.39 € |
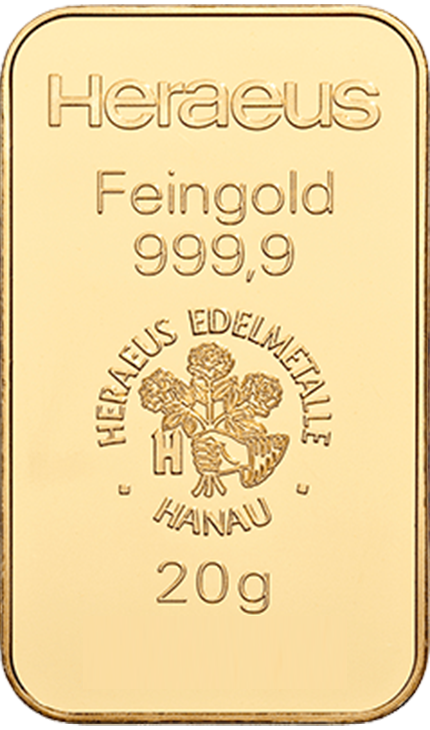 20g Goldbarren | 2,397.82 € | 2,295.37 € |
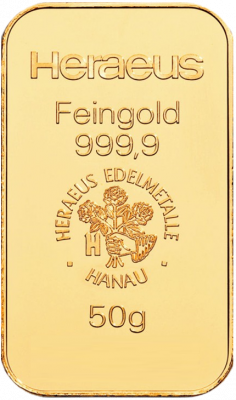 50g Goldbarren | 5,935.10 € | 5,714.94 € |
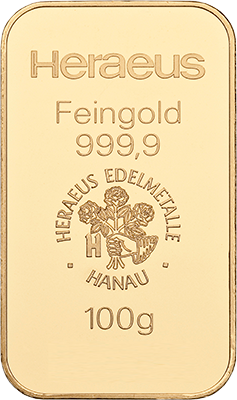 100g Goldbarren | 11,952.45 € | 11,434.57 € |
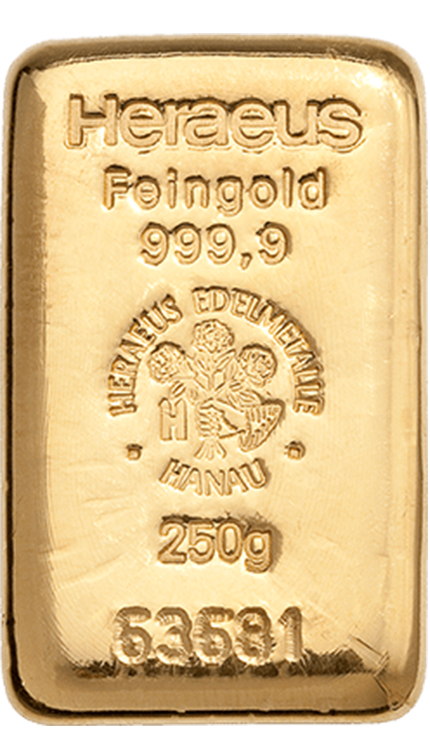 250g Goldbarren | 29,766.97 € | 28,513.00 € |
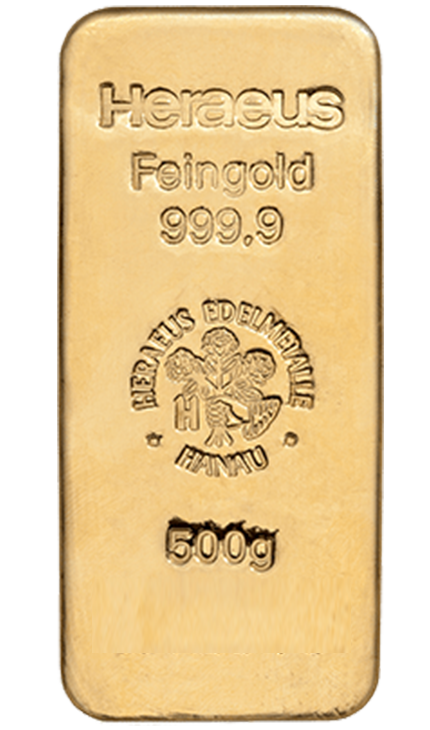 500g Goldbarren | 59,392.02 € | 57,190.50 € |
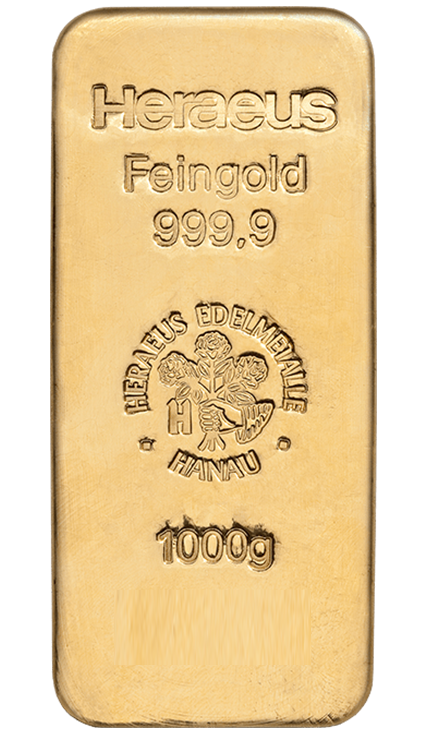 1000g Goldbarren | 119,502.46 € | 114,287.00 € |
Prices incl. taxes as per shop. No guarantee.
Silver bars
Bars at a glance
11.11.2026, 14:24
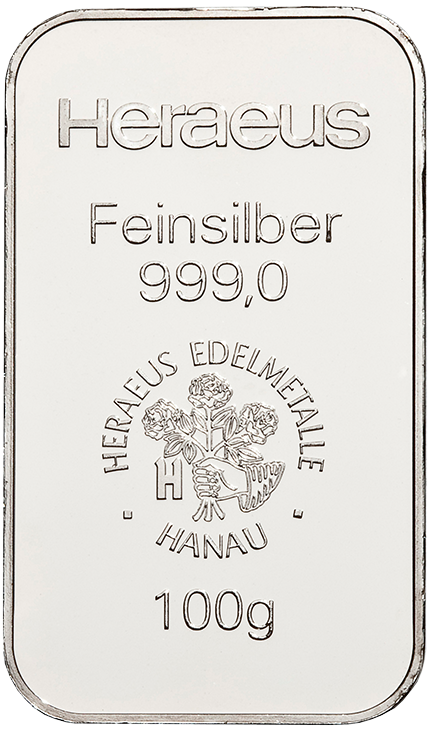 100g Silberbarren | 249.34 € | 147.35 € |
|---|---|---|
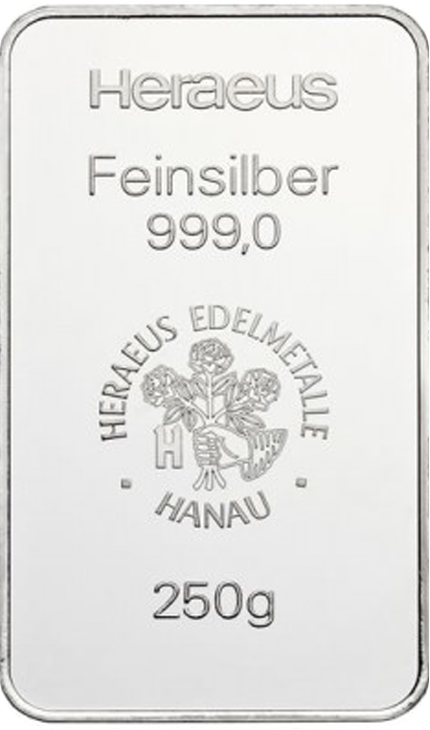 250g Silberbarren | 588.98 € | 349.14 € |
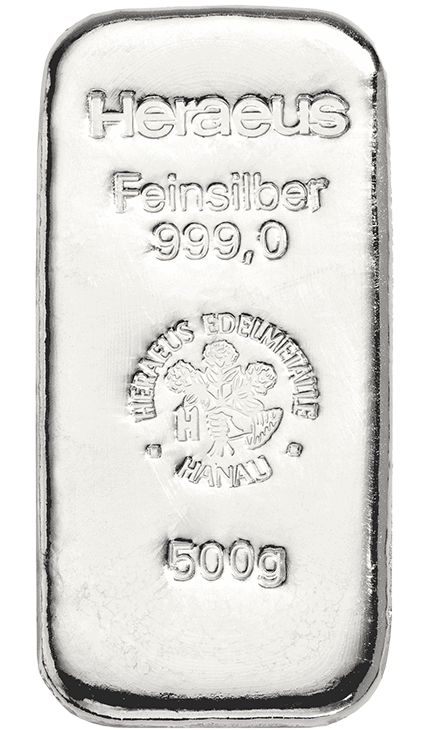 500g Silberbarren | 1,146.39 € | 698.28 € |
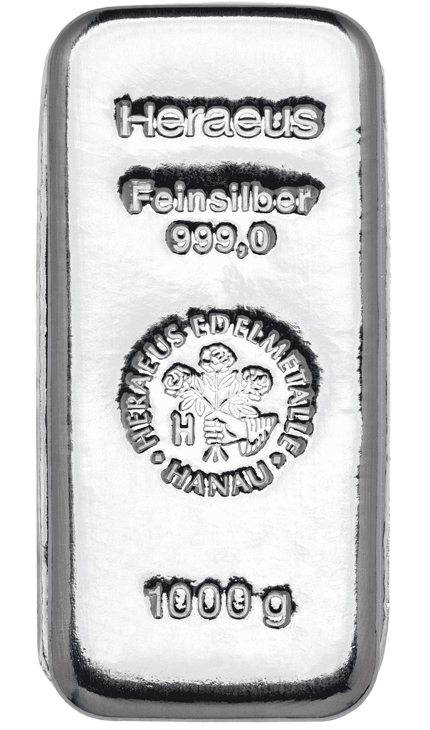 1000g Silberbarren | 1,931.85 € | 1,396.56 € |
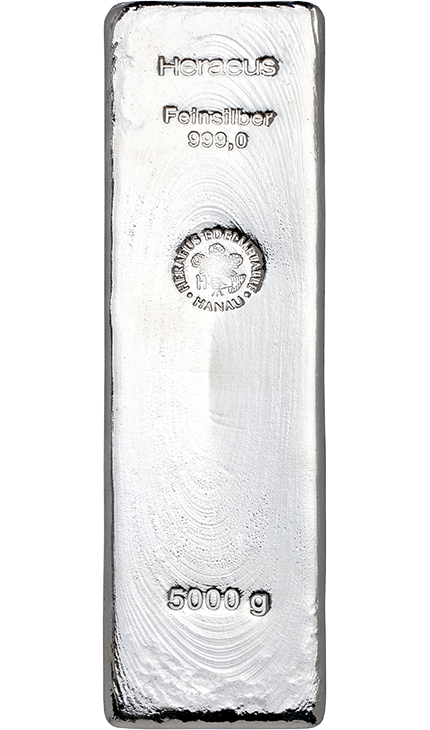 5000g Silberbarren | 9,655.11 € | 6,986.64 € |
Prices incl. taxes as per shop. No guarantee.
Platinum bars
Bars at a glance
11.11.2026, 14:24
 1g Platinbarren | 86.66 € | 44.74 € |
|---|---|---|
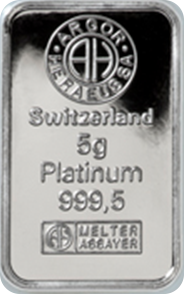 5g Platinbarren | 355.06 € | 222.53 € |
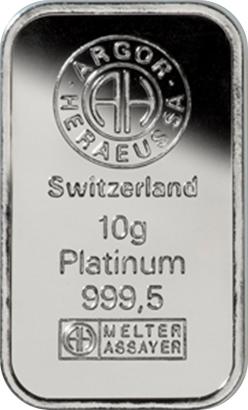 10g Platinbarren | 665.41 € | 442.70 € |
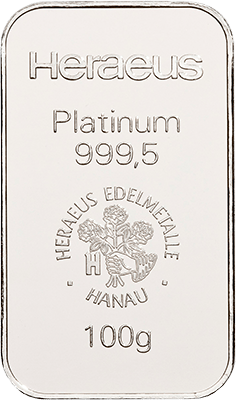 100g Platinbarren Diverse Hersteller | 6,053.39 € | 4,403.57 € |
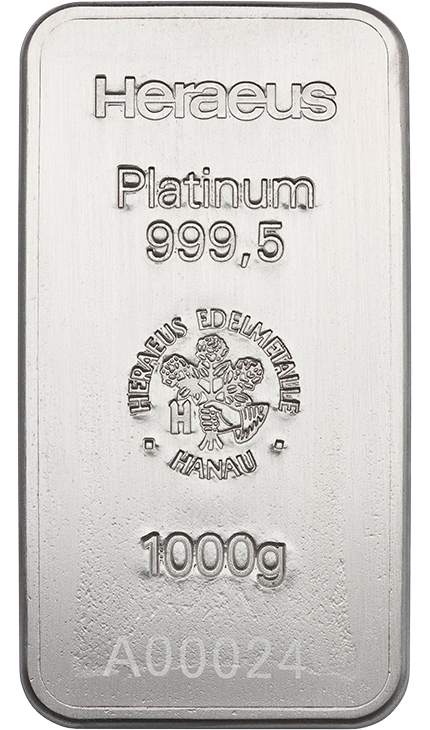 1000g Platinbarren diverse Hersteller | 60,254.49 € | 43,096.58 € |
Prices incl. taxes as per shop. No guarantee.
Palladium bars
Bars at a glance
11.11.2026, 14:24
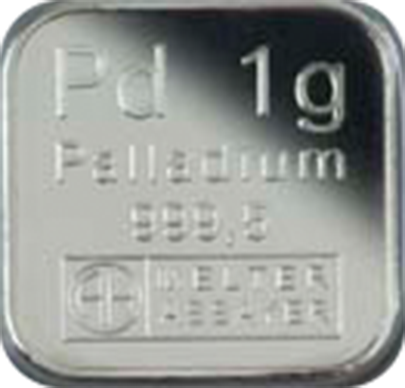 1g Palladiumbarrem | 1 g | 64.38 € | 31.39 € |
|---|---|---|---|
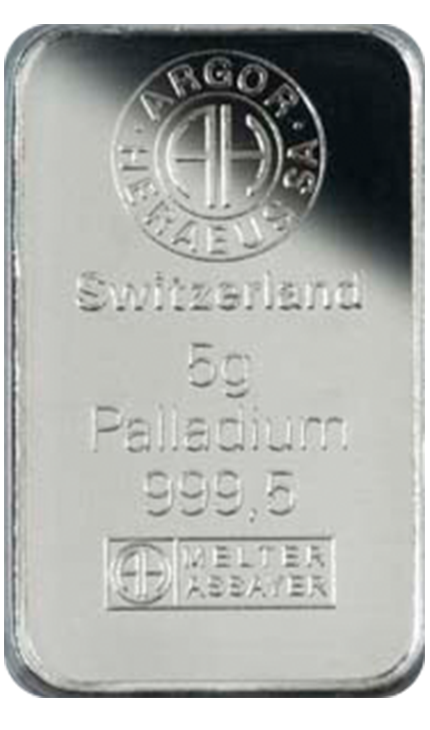 5g Palladiumbarren | 5 g | 250.70 € | 156.16 € |
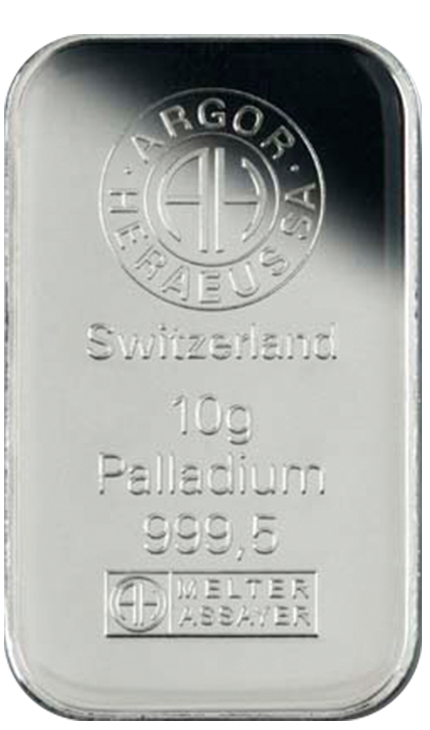 10g Palladiumbarrem | 10 g | 455.21 € | 310.71 € |
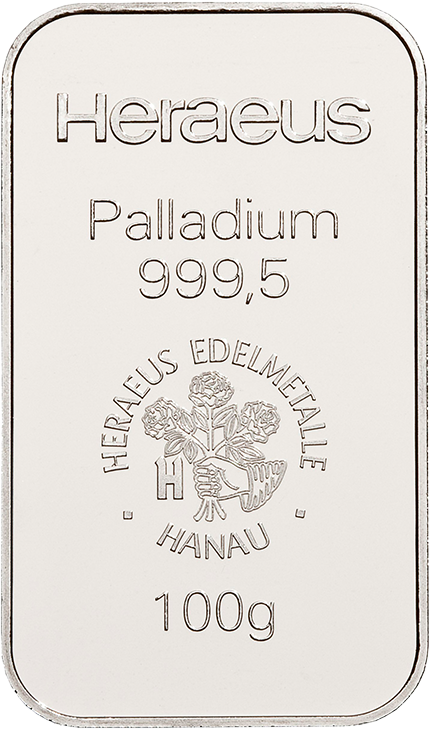 100g Palladiumbarrem Kopie | 100 g | 4,272.99 € | 3,090.90 € |
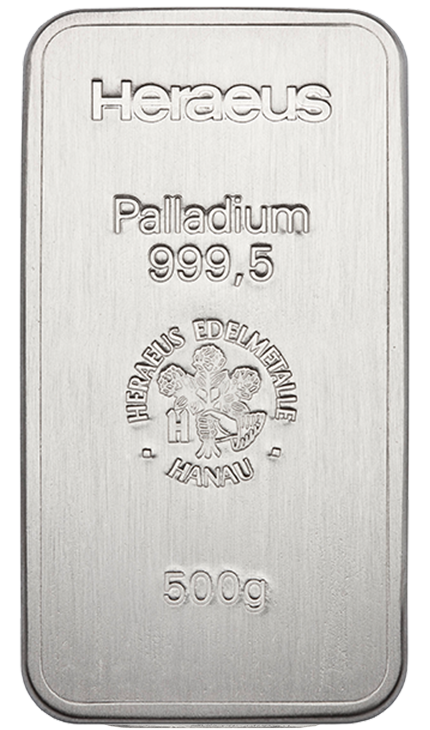 500g Palladiumbarrem | 500 g | 20,787.53 € | 15,373.62 € |
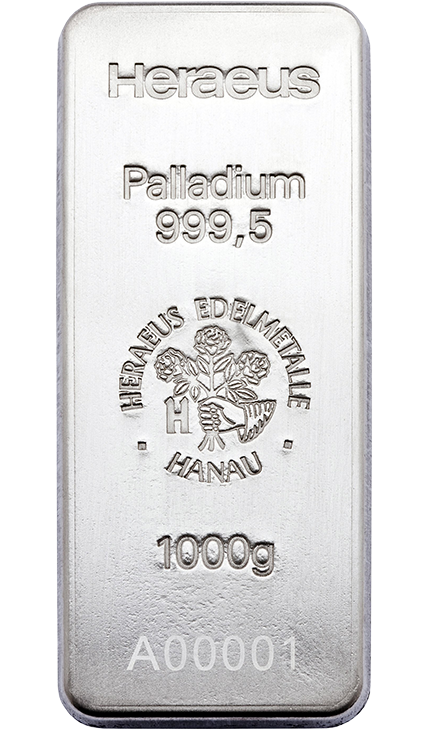 1000g Palladiumbarrem | 1,000 g | 40,997.64 € | 30,174.68 € |
Prices incl. taxes as per shop. No guarantee.
Buy Gold – accurate to the cent
From just 1 euro you buy parts of large bars at a favourable price per gram
As of: 11.11.2026, 14:21● live
Prices incl. taxes. No guarantee.
Buy Silver – accurate to the cent
From just 1 euro you buy parts of large bars at a favourable price per gram
As of: 11.11.2026, 14:21● live
Prices incl. taxes. No guarantee.
Buy Platinum – accurate to the cent
From just 1 euro you buy parts of large bars at a favourable price per gram
As of: 11.11.2026, 14:21● live
Prices incl. taxes. No guarantee.
Buy Palladium – accurate to the cent
From just 1 euro you buy parts of large bars at a favourable price per gram
As of: 11.11.2026, 14:21● live
Prices incl. taxes. No guarantee.
Performance
This is how a purchase of €1,000 would have developed since the year 2000.
€1,000 in Gold · start 2000
2025 11,364 €€1,000 in Silver · start 2000
2025 10,431 €€1,000 in Platinum · start 2000
2025 3,598 €€1,000 in Palladium · start 2000
2025 2,810 €All values as a table
| Year | Gold | Silver | Platinum | Palladium |
|---|---|---|---|---|
| 2000 | +0.89 % | −2.82 % | +52.15 % | +148.80 % |
| 2001 | +12.67 % | +2.84 % | −19.32 % | −58.32 % |
| 2002 | +5.35 % | −11.32 % | +10.93 % | −48.11 % |
| 2003 | −2.44 % | +10.50 % | +13.82 % | −28.47 % |
| 2004 | −1.31 % | +0.71 % | −2.91 % | −17.48 % |
| 2005 | +40.21 % | +49.79 % | +29.58 % | +59.14 % |
| 2006 | +7.14 % | +30.75 % | +4.17 % | +14.93 % |
| 2007 | +24.32 % | +9.82 % | +21.83 % | −2.03 % |
| 2008 | +7.34 % | −21.44 % | −33.52 % | −44.12 % |
| 2009 | +20.80 % | +46.19 % | +52.86 % | +114.10 % |
| 2010 | +29.57 % | +70.80 % | +22.11 % | +95.06 % |
| 2011 | +26.55 % | +12.01 % | −12.63 % | −13.84 % |
| 2012 | −2.17 % | −1.77 % | +5.86 % | +4.85 % |
| 2013 | −27.24 % | −37.56 % | −15.45 % | +0.63 % |
| 2014 | +17.92 % | +0.81 % | +2.38 % | +25.14 % |
| 2015 | −6.26 % | −12.46 % | −26.47 % | −31.73 % |
| 2016 | +11.06 % | +22.61 % | +16.26 % | +52.97 % |
| 2017 | −4.93 % | −13.67 % | −16.35 % | +22.29 % |
| 2018 | +2.29 % | −8.33 % | −14.38 % | +22.22 % |
| 2019 | +21.05 % | +18.56 % | +23.17 % | +50.01 % |
| 2020 | +22.32 % | +22.53 % | +2.72 % | +31.84 % |
| 2021 | +1.96 % | −7.54 % | −3.88 % | −13.13 % |
| 2022 | +5.57 % | +7.56 % | +13.76 % | −1.48 % |
| 2023 | +5.04 % | +4.81 % | −1.09 % | −38.34 % |
| 2024 | +18.29 % | +20.67 % | −11.35 % | −26.49 % |
| 2025 | +47.50 % | +133.20 % | +97.06 % | +55.28 % |
| Ø | +10.90 % | +13.36 % | +8.13 % | +14.37 % |
Calculated: €1,000 at the start of the year 2000.
Important to know: Past performance is not a reliable indicator of future performance. The value of precious metals can rise and fall. Figures exclude costs, fees and taxes.
Source: www.lbma.org.uk, 01/2026
Current market data
Prices
All prices per troy ounce (1 oz = 31.1035 g)
- Performance
- –
- High
- –
- Low
- –
Why Platinum?
Platinum is one of the most valuable precious metals in the world
Thanks to its outstanding properties, a metal with versatile uses in both medicine and industry. Platinum has the highest tissue and body compatibility of all precious metals and is therefore used for medical probes and pacemakers.
In industry, platinum is used in the production of catalytic converters and fuel cells. It is also a popular jewellery metal.
In 2000, demand was still 180 tonnes. In 2013 it rose to over 250 tonnes.
The increase is due to the versatility of this metal and to ever stronger demand from the investment sector.
The Asian jewellery industry is also turning to platinum more and more often.